

When a computer is used to calculate a result, these calculations inherently take some time. Often the calculations need to be performed within a certain duration; e.g., the control commands of a robot may need to be calculated within a certain interval in order to guarantee the desired control frequency. In other cases the situation is less strict, for example a webserver that hosts a website, there is no time limit on how long it can take to serve a page. However, serving the page as quickly as possible is still essential to providing a good user experience.
Profiling
We programmers try to write our code as efficiently as possible. Yet, from time to time we still run into a situation where the first implementation isn’t quite cutting it. In situations like this we’ll have to do some digging and investigating: first to figure out which part of the computation takes long, secondly determining why it takes long and finally coming up with an alternative solution that is faster. The first part, where we figure out what part of the computation takes the longest is called profiling.
There are multiple approaches to this, the simplest is obviously putting a few print statements or calculating the duration between some parts of code. This works for the trivial situations but this becomes increasingly less viable for larger projects. Some programming languages have tools build in, for example Pythons’ cProfile. Or have an interpreter that provides such information, like the browsers’ developer tools for web development.
When it comes to C++, gaining these insights is harder but not impossible; on Linux we can use perf to do sampling based profiling and visualise that into a flamechart. There are also commercial offerings such as vtune that make this more convenient. Besides sampling based profiling we can also instrument our source code with tracepoints. When the code is compiled and executed some data is stored when the tracepoint is encountered. These traces can then be analysed to gain more insight into the programs’ execution. There are tracing frameworks such as LTTng which provide means to create efficient tracepoints and help with recording and analysis.
Scalopus
Computer games are also on a strict time budget; to achieve the desired frames per second each frame needs to be calculated within a certain duration. Additionally, no single frame may take significantly longer than other frames, as this will result in a jerky experience. Showing the variation is something that is impossible to do with sampling based profilers, since they average the accumulated samples to provide the bigger picture. My inspiration for Scalopus came from this slide from the cppcon 2016 “Rainbow Six Siege: Quest for Performance” presentation, the whole presentation is worth the watch. This slide shows the ui of the profiler they used while developing that game. It visualises the time spent in annotated parts of the code or function frames. Showing this in a nice graphical representation that makes it easy to identify outliers.
After seeing that slide I was intrigued, requiring the tracepoints to be placed by the developer seemed reasonable to me, this provides a lot of control to balance the amount of data (and thus performance penalty). I liked the time-based visualisation, this ensures that outliers can be picked out easily and don’t disappear into the averaging. After some searching I did not come across an open source project that has this functionality, so I decided to build it.
The following three bullet points were my main considerations in this process:
- A graphical representation of time durations of scopes or sections in the program.
- Modifying the program to place tracepoints instrumentation gives the developer control.
- A convenient workflow that doesn’t require running a binary inside a traced environment.
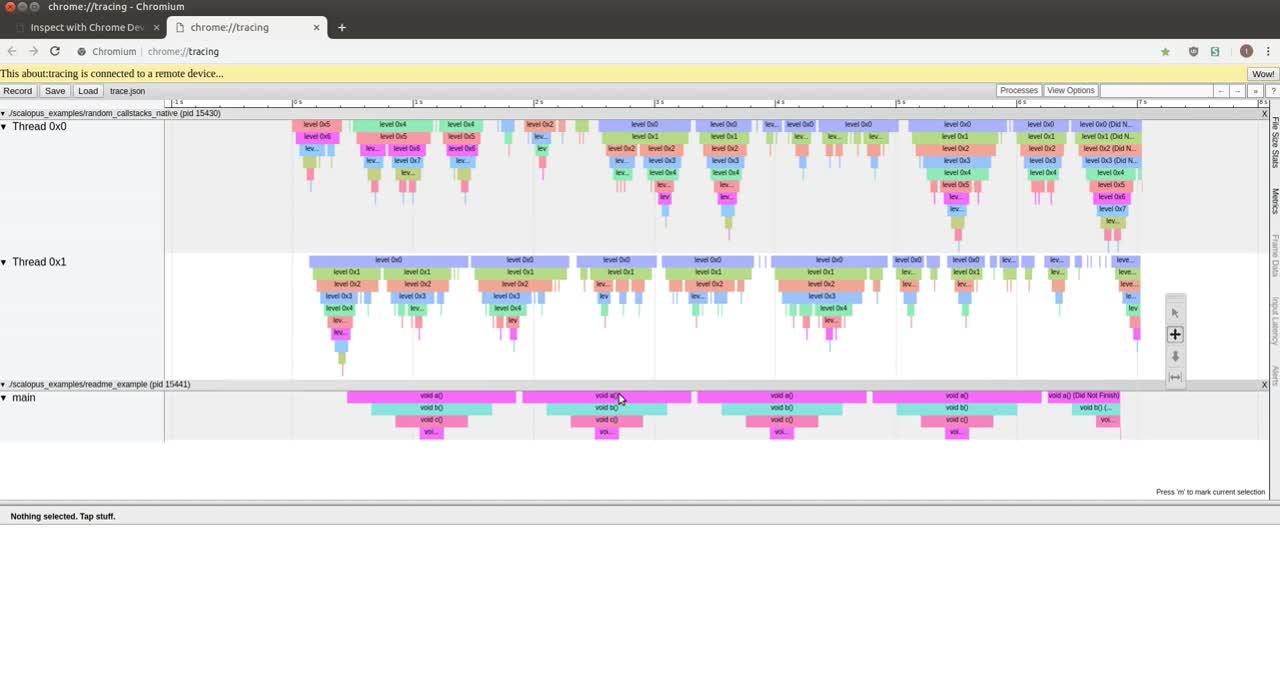
To achieve this convenient workflow several components were needed. One processes, the catapult_server, acts as a remote tracing target for the viewer, it connects to the processes we are tracing (two in the case of the video) and collects the tracepoint data and metadata. Originally I used LTTng to transfer the tracepoints, because it is highly performant and allows for a lot of configuration. However, Scalopus can also be used without having to use LTTng. To trace your program you have to add code that allows the catapult_server to obtain the tracepoint metadata from the process. After that you can add tracepoints anywhere in your program:
void a()

{
std::cout << "a" << std::endl;
std::this_thread::sleep_for(std::chrono::milliseconds(200));
b();
std::this_thread::sleep_for(std::chrono::milliseconds(200));
}
For the duration that the program is inside the void a() function the trace viewer will show this:

Released on GitHub!
I hope this gets you excited about trying this tracing framework to discover the bottlenecks in your code. Besides C++ it can also be used for both Python2 and Python3 through the provided Python bindings and module. The Scalopus project is open source and available at https://github.com/iwanders/scalopus. The GitHub page has a lot more explanation and documentation on how this works and how to use it. Lastly, I would like to thank my amazing colleagues at OTTO Motors for allowing me to bounce ideas off them during lunch.
Want to help us squeeze the maximum use out of our CPU’s? Check out the current job postings.